The Goodman diagram enables the representation of the Fatigue strength of coil springs. It can be traced back to the Smith chart. This is used to calculate the fatigue strength of dynamically stressed components where the load is pulsating or alternating. In the Goodman diagram, on the other hand, only the fluctuating load is recorded. Because coil springs, like Compression springs or Tension springs , are only stressed in one direction – either in tension or in compression.
Table of Contents
How is the fatigue strength of coil springs determined?
As a basis for the Spring calculation serves the Smith chart. This in turn depends on the Wöhler method , with which the fatigue strength of different components is recorded.
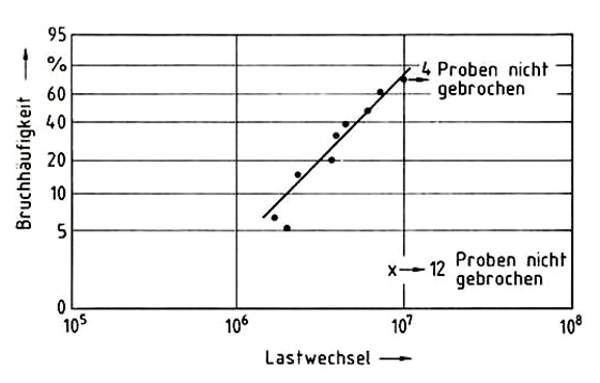
Determination of the Wöhler curve
With suitable test machines, coil springs are subjected to vibration tests with different levels of stress until the material breaks or a sufficient number of samples has reached the limit number of cycles without breaking. The time and fatigue strength values are combined in one Wöhler diagram recorded and the nominal stress amplitude shown in it over the number of cycles. By using static evaluation methods, the so-called Wöhler lines are obtained to limit the stray field. The probability of survival of the samples is 90 percent.
Derivation of the Smith chart
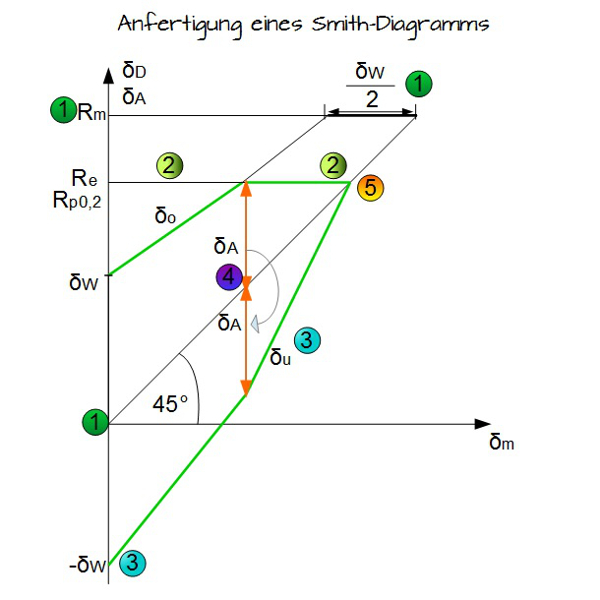
From the large number of Wöhler lines that were determined for different load conditions, the fatigue strength diagram according to Smith is created. This includes both fatigue strengths and swelling strengths and serves as the basis for the simplified Goodman diagram derived from it.
The Goodman fatigue limit diagram
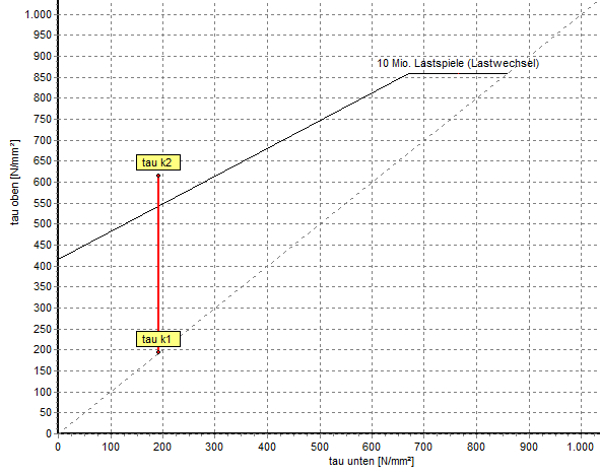
The Goodman diagram shown represents the possible fatigue strength range of the Spring material between the high voltage ƬkO and the undervoltage ƬkU for a number of load cycles of 10 7th Load changes. The compression spring is fatigue-resistant if the calculated stroke stress ƬkH (Ƭk1 to Ƭk2) remains within the limited fatigue strength range.
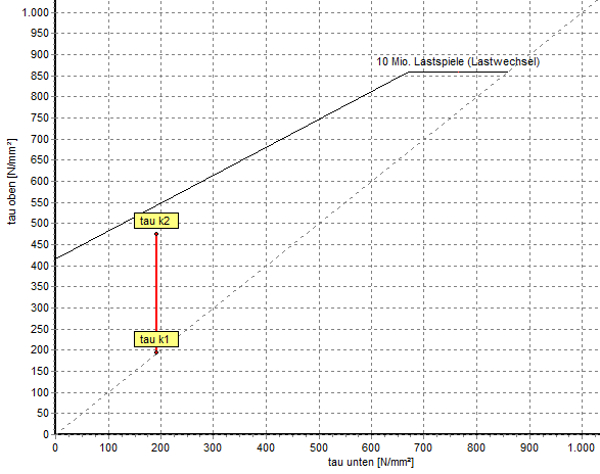
However, if the stroke stress in the Goodman diagram extends beyond the fatigue limit, the Metal spring not permanent and must be recalculated:
The Goodman diagram is used in the fatigue strength calculation of compression springs in Spring calculation program WinFSB expelled.
Further informative links: